Yearly Archives: 2023

Concrete and Biosphere 2 Biomes

by Grant Hawkins, lead developer for SIMOC B2 at Over the Sun, LLC

Storytelling is a core part of SIMOC, especially when it comes to the educational components. As we integrate Biosphere 2 into SIMOC, we’re focused on telling one story in particular: how the soil and concrete conspired to crash O2 levels during Mission 1.

This story was first told in a research paper from January 1994, Oxygen Loss in Biosphere 2. Over the course of Mission 1, the O2 level in the habitat fell quickly, but the CO2 levels didn’t show the expected corresponding rise. The obvious hypothesis is that there was an unaccounted-for O2 consumer. The paper showed that in fact two separate processes were more active than was expected: soil respiration, which consumed O2 and produced CO2, and concrete carbonation, which consumed CO2. The combined effect of both of these was the observed ‘O2 consumer’. We created 5 new agents in SIMOC – 1 concrete and 4 soil-containing biomes – and calibrated them to the measurements in the research paper.

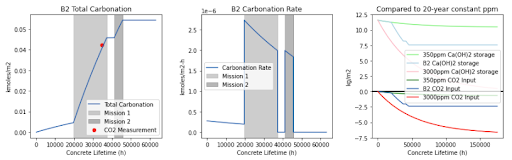
The concrete agent models the process of carbonation. Each step of the simulation, carbonation occurs based on a diffusion rate and a saturation point. The saturation point is heavily dependent on the current CO2 concentration in the atmosphere, however, more than 10x higher under extreme conditions like those at Biosphere 2, which accounted for the unexpected difference in total uptake. We corresponded by email with Bill Dempster, an author of the paper above, about the problem and our approach to it.

Concrete and Biosphere 2 Biomes by Grant Hawkins for SIMOC

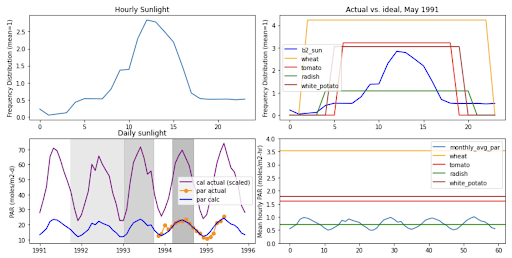
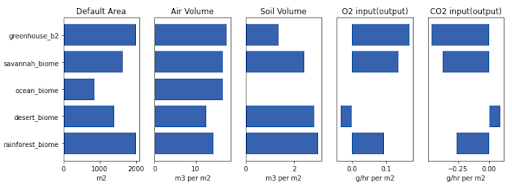
The biomes model the combined effect of the soil and ground vegetation in the rainforest, savannah, desert and intensive agriculture biome (farm). A paper from 1999 measured the net productivity of the rainforest and desert biomes, and the Oxygen Loss in Biosphere 2 paper gives the habitat-wide soil respiration.

Concrete and Oxygen by Grant Hawkins for SIMOC

If all goes according to plan, the net effect of the humans, plants, concrete and biomes will be the drop in O2 observed in real life. This then becomes a story we can tell in SIMOC: the oxygen levels fall much faster than carbon dioxide rises, and the user can discover that it’s being ‘caused’ by the concrete and biomes.

By |2023-03-16T05:36:25-07:00January 29th, 2023|Categories: Research & Development|0 Comments

Plant Light Response

by Grant Hawkins, lead developer for SIMOC B2 at Over the Sun, LLC

In mid-2022, our team took on the challenge of modeling Biosphere 2 (B2) in SIMOC. Beyond simply describing the outcomes and making sure that they match the published data, we also had to make sure that — The system and sub-systems responded correctly to changes in the configuration. When a user changes the area of sweet potatoes or the CO2 scrubber activation threshold, other agents are responding appropriately to those changes.

The sub-systems remain accurate on the original SIMOC validation data, the NASA CELSS growth-chamber experiments. There, plants were grown in highly-controlled environments in order to maximize their food productivity. For certain plants, the production rate in kg/m2-day was as much as 10x greater at CELSS than in Biosphere 2.

Light was found to be the biggest contributing factor to the differences in plant productivity. At CELSS, plants received constant-output electric lighting at an optimal level for an optimal number of hours per day. These ranged from 1.4 Mol/m2-h for 12 hours/day for rice, to 3.53 Mol/m2-h for 20 hours/day for wheat. At B2, the plants received whatever sunlight passed through the B2 windows and structural frame. Our approach was to use the CELSS data as the baseline for SIMOC plant consumption and production, and

The first step toward implementing SIMOC-B2 was to add a ‘light-response’ mechanism to the SIMOC plant agent. We added a new variable, ‘par_factor’, which scales the rate of biomass accumulation to the species-specific, hourly light requirement. The other functions of the plant (photosynthesis) are scaled to its total accumulated biomass, so the light response will be applied to those exchanges as well.

So this was a big step forward for the accuracy and flexibility of our plant growth model, but that wasn’t all. Some of the deeper changes to how exchange values are calculated led to a major reduction in memory footprint – more than 80% for simulations with more than one plant – which is great news for our cloud computing budget 🙂

Plant Light Response by Grant Hawkins for SIMOC

By |2023-03-16T05:36:58-07:00January 5th, 2023|Categories: Research & Development|0 Comments
Go to Top