Support update
The SIMOC team is slowly but surely working to correct a number of small but important issues in the SIMOC experience, as follows:
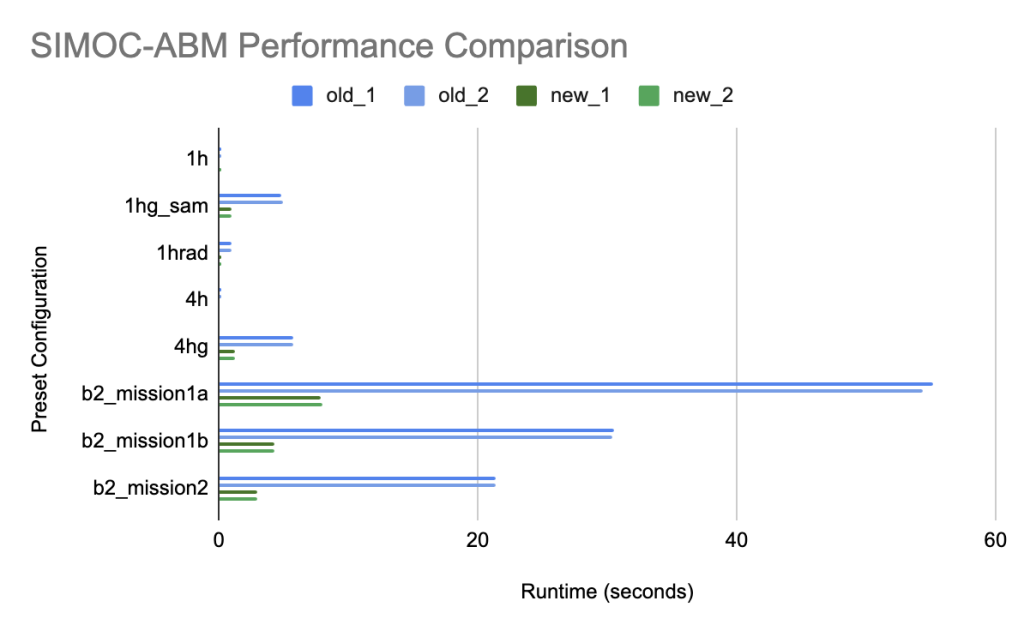
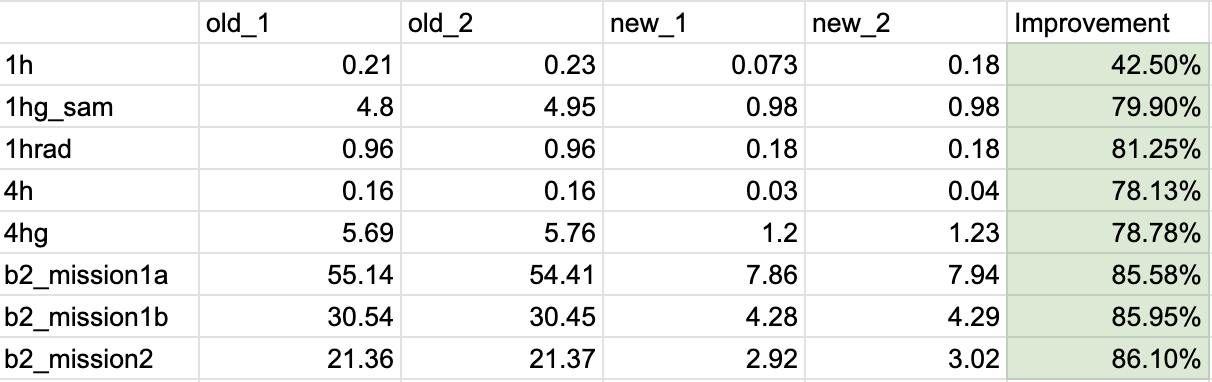
- Presets
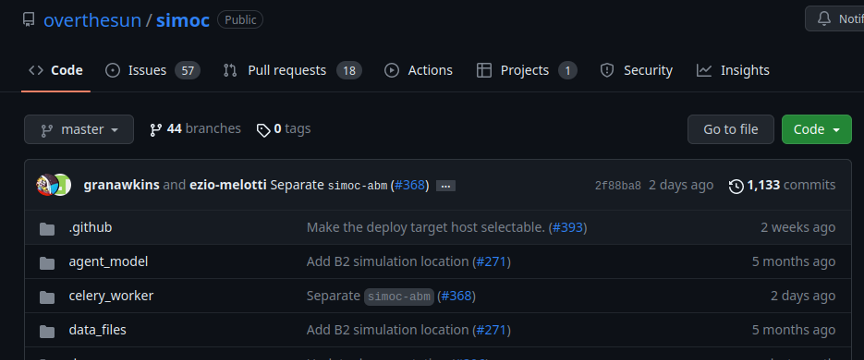
- Front-end library updates and fixes
- Deploying latest version of all libraries
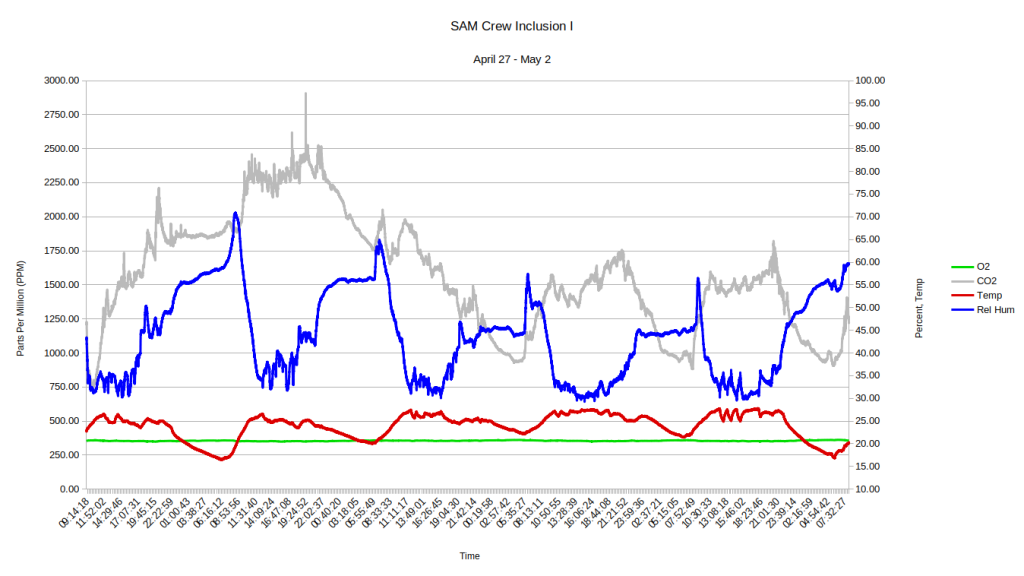
- Designing and prototyping new web dashboard