Yearly Archives: 2023

Interview for Biosphere 2 Podcast

Space Analog for the Moon and Mars
by Aaron Bugaj

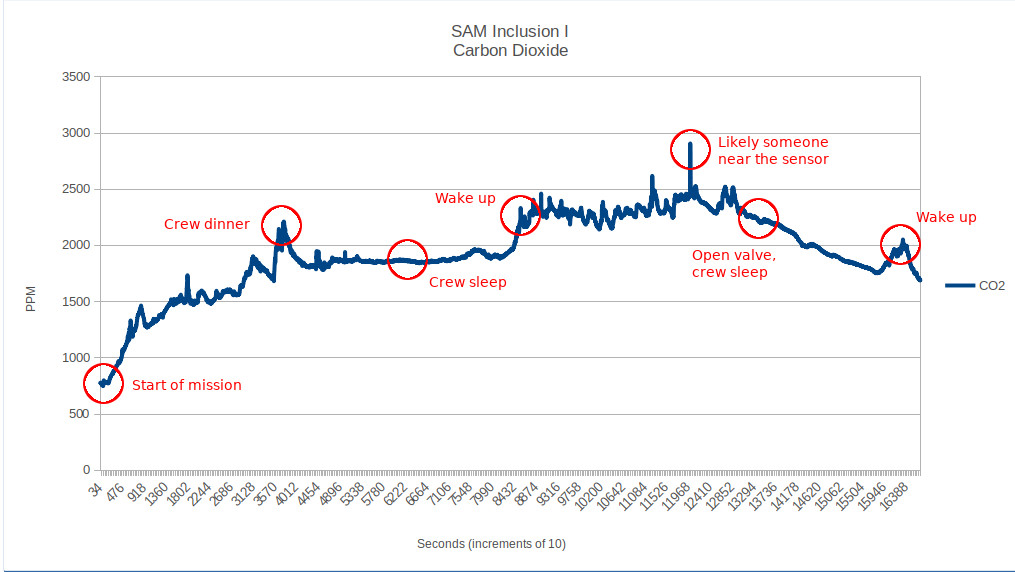
In this episode we are joined by Kai Staats. Kai is a veteran developer, designer, filmmaker, and scientist. Kai is the Director of SAM, Space Analog for the Moon and Mars, here at Biosphere 2. SAM is a hi-fidelity, hermetically sealed Mars habitat analog with greenhouse, living quarters, airlock, pressure suits, and a half acre Mars yard. Since 2021 Kai and his team have been constructing SAM, and just last month, SAM hosted it’s first two sealed missions, Inclusion 1 and Inclusion 2.

In this podcast, Kai takes us on his journey to build SAM. Breaking down the inspiration for SAM’s creation, and the research goals for SAM’s future.

Listen to the full interview via Spotify or Apple Podcast

By |2023-08-16T21:05:16-07:00August 16th, 2023|Categories: In the news|0 Comments

New ABM engine now operational!

a SIMOC ABM upgrade

a SIMOC ABM upgrade The Agent-Based Model (ABM) at the heart of SIMOC has been rewritten from scratch for consistency and speed. Over the years, many individuals had contributed to the SIMOC ABM, each bringing their own programming skills and vision for how SIMOC could develop into the future. Now, as we take SIMOC open-source, it’s a good time to remove inconsistencies and establish norms going forward.

Some key features of the updated ABM are:

  • A single agent schema is used throughout the entire application: defining the agent, defining the configuration, initializing the ABM, exporting data and saving the ABM. This will greatly reduce the learning curve for new-comers.
  • All agent parameters are stored as either `properties` (static, e.g. ‘harvest_ratio’) or `attributes` (dynamic, e.g. ‘daily_growth_factor’). Besides streamlining the code, this will make the SIMOC web app compatible with custom agents out-of-the-box.
  • Unit testing and documentation are incorporated from the start.

We’re seeing up to 85% speedup for large simulations, meaning it’s much faster for users and the demand on our servers is lower.

Altogether, the new ABM is a tremendous upgrade for our users, and puts us on a better footing for long-term growth and collaboration.

By |2023-08-13T01:12:35-07:00August 7th, 2023|Categories: Research & Development|0 Comments

Almost open source!

The SIMOC development team has just a few, finishing touches to apply to the code and documentations before providing both the back-end server (Agent-Based Model, or ABM) and front-end client (Dashboard) available via the GPL3 and Community Commons licenses, respectively.

We are eager to take six years of development and provide it to you, for free, to gain your input, ideas, and ultimately improved code.

Stay tuned!

By |2023-07-07T01:18:49-07:00June 29th, 2023|Categories: Research & Development|0 Comments

3 papers accepted to the ICES 2023 Conference

For the International Conference on Environmental Systems (ICES 2023, hosted in Calgary, Canada, these three papers are accepted and will be presented:

Ecosystem Modeling and Validation using Empirical Data from NASA CELSS and Biosphere 2
– Session: ICES300: ECLSS Modeling and Test Correlations
– Authors: Grant Hawkins, Ezio Melotti, Kai Staats, Atila Meszaros, Gene Giacomelli

Integration and Validation of Mushroom and Algae into an Agent-based Model of a Physico-chemical and Bioregenerative ECLSS
– Session: ICES204: Bioregenerative Life Support
– Authors: Sean Gellenbeck, Joel L. Cuello, Barry Pryor, Kai Staats, Chuck Gerba

Integrating Real-Time Environmental Data into an Educational Web Interface
– Session: ICES307: Collaboration, Education Outreach, and Public Engagement
– Authors: Meridith Greythorne, Gregory Ross, Ian Castellanos, Grant Hawkins, Ezio Melotti, Ryan Meneses, Kai Staats, Gretchen Hollingsworth

Visit our Publications page for the complete list.

By |2023-08-12T23:58:53-07:00May 30th, 2023|Categories: Publications|0 Comments

SIMOC Live monitors life support at SAM Mars habitat analog

SIMOC Live data capture for CO2, O2, RH, and temp for the duration of the crew Inclusion I mission at SAM, Biosphere 2

For better or for worse, all modern homes, offices, and classrooms are fairly tightly enclosed to reduce energy loss. This results in greater than outdoor ambient carbon dioxide levels, higher than most people realize. With ambient global CO2 at 420 parts per million (ppm) it is not unusual for an indoor, occupied space to be well over 1000 ppm, sometimes 1500, 2500, or more. Offices, classrooms, conference halls, even your dining room with a family gathering are in these higher ranges for extended periods of time.

OSHA suggests that the upper, safe limit is exposure to 5000 ppm for up to 8 hours. The International Space Station operates between 3000 and 6500 ppm. And the US Navy submarines are unconfirmed to operated as high as 10,000 ppm. There is little evidence to suggest that any short- or long-term health issues are associated with the upper ranges of CO2 for brief (a few hours) exposures. The astronauts on the ISS live with 5000 ppm for up to a year. While some research shows reduced cognitive function (e.g. math problem solving), there are is no risk of long term damage.

As SAM is hermetically sealed, we must monitor the CO2 levels even more carefully than in our homes, schools, and places of work. While an office might rise over 1500 on a frequent basis, the door is likely being opened, with people moving in and out with the effect of mixing the air.

For these first two mission, SAM is operating in Mode 2 (pressurized, flow-through). The crew is able to adjust valves in the Test Module, airlock and crew quarters and then the speed of the in-bound blower. The combination of the two affects the overall carbon dioxide in SAM.

SIMOC Live data capture for CO2 for the first two full days of the crew Inclusion I mission at SAM, Biosphere 2

Crew Inclusion I reached out on Day 2 with concern for the rising CO2. Director of Research Kai Staats logged into the SIMOC Live server to retrieve the data to that moment. SIMOC Live captures carbon dioxide, oxygen, relative humidity, temperature, pressure, and a number of other values for the duration of the mission. This data is exported to a local .csv file which the SIMOC-SAM team members can copy through a data backdoor that bypasses the router which limits crew to email only.

As with all time-series data, it takes a full cycle (in this case day-night-day) to recognize a trend. Indeed, the initial rise in CO2 climbed over 2500. This is nothing to be concerned about, but the crew wanted to bring it down, in part to demonstrate their ability to control the quality of air.

Crew Inclusion I worked extensively with SAM Mission Control to monitor and maintain the carbon dioxide levels. Crew engineer Bailey Burns conducted spot assessments of CO2 throughout the habitat while the SIMOC Live sensor array was capturing a time series dataset from closure to the end of the mission. Bailey’s data confirmed the air flow from SAM Lung to TM to Engineering Bay to Crew Quarters with an increasing density of carbon dioxide.

Mission Control advised that the sound muffler be removed from the outlet at the end of the crew quarters and an additional port be opened in the airlock. While the airlock is not at the termination of the designated airflow path, it does invoke the need to increase the blower in order to keep the lung at a nominal height, and therefore is in fact moving more air with the effect of bringing overall CO2 levels down.

In response to the crew’s request for assistance, acting CapCom Kai Staats wrote, “You have done well to reduce your carbon dioxide over the past two days. You started at roughly 700 ppm (due to all the activity inside SAM prior to entry) and rose to nearly 3000 ppm which is when you reached out for guidance. The day/night activity/sleep cycle is clearly present with a leveling of CO2 while you sleep. But overall, the trend has been down with a reading this morning of just under 1000 ppm. According to the data, you rose at 6 am.”

(see plot above for associated data points and graphical narrative)

The temperature held relatively steady, between 20 and 25C, with a dip to 16C the first night. The relative humidity ranges from 30% to 70%, clearly following a day/night cycle. This is due to “relative” humidity as a measure of moisture in the context of changing temperature, and therefore density of air. But is also due to the fact that at night the A/C units stop running their condensers, therefore the dehumidification function terminates and the humidity rises until the temperature is again high enough to activate the cooling cycle.

In the end, Crew Inclusion I was able to control their CO2 levels effectively (as demonstrated in the graph above). Given initial concerns for CO2 levels, the SAM team now realizes the importance of asking our visiting research crew to reduce their caffeine and processed sugar intake prior to arrival to SAM.

By |2023-11-25T19:44:14-07:00May 3rd, 2023|Categories: Research & Development|0 Comments

SIMOC coming to github soon!

The SIMOC developer team is preparing to open source the entire platform, from back-end server to front-end web client so that developers, educators, and citizen scientists too can benefit from this unique, powerful agent-based model and simulation around the world, for free.

Stay tuned!

By |2023-04-12T15:17:39-07:00April 12th, 2023|Categories: Research & Development|0 Comments

SIMOC-B2 Results and Validation

by Grant Hawkins, lead developer for SIMOC B2 at Over the Sun, LLC

The final step of integrating Biosphere 2 into SIMOC was validating the outputs. From the beginning, we’ve focused on telling the story of oxygen depletion during Mission 1, as described in the paper Oxygen Loss in Biosphere 2, published in 1994. This paper describes the overall O2 and CO2 behavior within B2 for the first ~18 months of Mission 1, as well as the rates of O2 and CO2 consumption and production for key agents such as the concrete and soil.

First, we compared overall levels of O2 and CO2 throughout the mission:

SIMOC-B2 Results and Validation by Grant Hawkins for SIMOC

SIMOC-B2 Results and Validation by Grant Hawkins for SIMOC

We also compared net effects of processes specified in the paper:

Field Actual Simulated Error
Pure O2 added on days 475 – 494 7,055 6,978 -1.09%
Total CO2 taken up by scrubber -4,313 -5,069 17.53%
Soil respiration O21 -11,327 -11,190 -1.21%
Soil respiration CO21 29,135 30,782 5.65%
CO2 captured by concrete -24,205 -22,121 -8.61%


These figures help us identify where the model is reliable, and where it needs to be improved. Below is the ‘Discussion’ section of a paper we’ve written on this process:

The results of the simulation are directionally accurate, but with a low degree of precision. Relatively few measurements of plant productivity are available from the B2 experiments, and SIMOC’s other validation reference is a highly dissimilar experiment. To improve precision of the plant model, we make the following recommendations:

  • Include fruit trees and other perennial plants in addition to vegetables. These made up a large part of the B2 crew’s actual diet, and follow a different growth cycle.
  • Model the impact of specific pests and parasites. As records allow, match periods of low productivity for specific plants with their causes – most often fungi or mites. In the case of corn, no edible food was produced in Mission 1a and 1b because it is wind-pollinated, and there was no wind inside the structure. This and other species-specific behaviors could increase the accuracy as well as the educational potential of SIMOC.
  • Include some metric of human wellness besides simple survival. Some of the difference in plant productivity between Missions 1 and 2 can be attributed to crew energy levels and morale. Taking into account nutrition, workload, variety of diet, etc. and giving an overall indication of crew’s well-being will be useful in optimizing these systems, and for making the simulations more engaging.

Despite this imprecision, the measured system-level behaviors of the B2 missions are observable in the simulation. By making adjustments the base configurations, users can also observe the following phenomena:

  • Plant growth can be increased by adding supplemental lighting (at the cost of increased electric consumption), or decreased by reducing CO2 setpoint to <700ppm.
  • Crop layouts can be adjusted to add higher-yield crops, or crops which transpire and photosynthesize at different rates, affecting overall gas balances.
  • The starting concrete carbonation rate can be adjusted, which affects the rate at which it consumes CO2. This is also affected by the ambient CO2 levels, with lower rates of carbonation when CO2 levels are lower.
  • Adjusting the areas of each biome impacts (1) the size of the air sink, and therefore the overall changes in concentrations, (2) O2 and CO2 exchanges, as each biome has a different rate.
By |2023-03-16T05:46:32-07:00March 15th, 2023|Categories: Research & Development|0 Comments

SIMOC B2 is live!

SIMOC B2 for Biosphere 2

In completion of a seven months development endeavor, a simulation of the original and second missions at Biosphere 2 are now incorporated into SIMOC and available for free from the National Geographic Society’s educational web portal.

The intent of SIMOC is to provide a model of Biological Life Support Systems for human space exploration. SIMOC was originally built around an ideal plant growth scenario (NASA CELSS growth chamber experiments and the NASA BVAD document), and was calibrated so that the simulation reproduced similar outcomes as given in published NASA experiments. The reality of a Moon or Mars habitat will be less than ideal, where the original Biosphere 2 missions are likely a closer approximation to how things might actually play out.

SIMOC B2 adds new degrees of freedom to the plant model (light response, planting density, crop management) as well as other new agents (concrete, biomes) such that the model reproduces experimental data from both NASA CELSS and the original Biosphere 2 missions with a single model. We attribute the large differences in plant productivity (up to 10x) and validate the system-level outputs against experimental B2 data.

By calibrating the model to these two extremes, we’re granting researchers, students and citizen scientists greater insight into the historical data from both and an opportunity to evaluate and compare a wider range of different BLSS scenarios with higher accuracy.

By |2023-04-12T07:29:06-07:00March 9th, 2023|Categories: Research & Development|0 Comments

The Biosphere 2 Configurations in SIMOC

by Grant Hawkins, lead developer for SIMOC B2 at Over the Sun, LLC

The final step of integrating Biosphere 2 into SIMOC was building the configuration files, which specify how many of each agent to include in a simulation, their starting resource balances, etc. Our aim was to replicate the real-life Biosphere 2 experiments: Mission 1 (September 26, 1991 to September 26, 1993) and Mission 2 (March 6, 1994 to September 7, 1994).

There was a major non-linearity in Mission 1 of course, which was the extra oxygen added to the habitat, beginning on January 12, 1993, 475 days into Mission 1. Some other changes were made throughout the experiment, such as adjusting the planting areas of different crops to maximize calorie-production and CO2-sequestration. To account for this, we split Mission 1 into two configurations: Mission 1a for before the O2 was added, and Mission 1b for after O2 was added. The configuration of 1b starts with the final atmosphere and concrete carbonation of Mission 1a, and includes an O2 resupply system and modified greenhouse layout.

The feature of significance for Mission 2 was improved plant productivity. We spoke with Tilak Mahato, one of the crew member on Mission 2 usually credited with improving output, and currently a researcher of Controlled Environment Agriculture at the University of Arizona. He described several specific practices that improved output:

  • Removing pests immediately. Because pest populations grow so quickly, catching and remediating an infestation early has an outsized impact.
  • Taking care not spread pests, fungi or diseases via contaminated tools.
    Washing diseased leaves with soap and water.
  • Protect seedling growing areas from roaches and other pests.
  • Pollinating plants by hand. During Mission 1, the entire corn crop had failed to produce food because there was no wind to spread pollen from the (male) tassels to the (female) silk. Other plants’ pollen had been washed away by overhead irrigation.

There was no ‘primary’ factor, according to Tilak, to which the improvements in productivity could be attributed. For this reason, we added a simple field to SIMOC, ‘Improved Crop Management’, which increases productivity of the plants by 50%, and describe the specific processes above in the SIMOC web app.

The result of these 3 configurations is encouraging so far!

By |2023-03-16T05:39:11-07:00February 14th, 2023|Categories: Research & Development|0 Comments
Go to Top