
by Grant Hawkins, lead developer for SIMOC B2 at Over the Sun, LLC
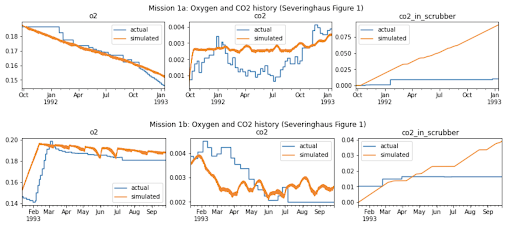
The final step of integrating Biosphere 2 into SIMOC was validating the outputs. From the beginning, we’ve focused on telling the story of oxygen depletion during Mission 1, as described in the paper Oxygen Loss in Biosphere 2, published in 1994. This paper describes the overall O2 and CO2 behavior within B2 for the first ~18 months of Mission 1, as well as the rates of O2 and CO2 consumption and production for key agents such as the concrete and soil.
First, we compared overall levels of O2 and CO2 throughout the mission:

We also compared net effects of processes specified in the paper:
| Field | Actual | Simulated | Error |
| Pure O2 added on days 475 – 494 | 7,055 | 6,978 | -1.09% |
| Total CO2 taken up by scrubber | -4,313 | -5,069 | 17.53% |
| Soil respiration O21 | -11,327 | -11,190 | -1.21% |
| Soil respiration CO21 | 29,135 | 30,782 | 5.65% |
| CO2 captured by concrete | -24,205 | -22,121 | -8.61% |
These figures help us identify where the model is reliable, and where it needs to be improved. Below is the ‘Discussion’ section of a paper we’ve written on this process:
The results of the simulation are directionally accurate, but with a low degree of precision. Relatively few measurements of plant productivity are available from the B2 experiments, and SIMOC’s other validation reference is a highly dissimilar experiment. To improve precision of the plant model, we make the following recommendations:
- Include fruit trees and other perennial plants in addition to vegetables. These made up a large part of the B2 crew’s actual diet, and follow a different growth cycle.
- Model the impact of specific pests and parasites. As records allow, match periods of low productivity for specific plants with their causes – most often fungi or mites. In the case of corn, no edible food was produced in Mission 1a and 1b because it is wind-pollinated, and there was no wind inside the structure. This and other species-specific behaviors could increase the accuracy as well as the educational potential of SIMOC.
- Include some metric of human wellness besides simple survival. Some of the difference in plant productivity between Missions 1 and 2 can be attributed to crew energy levels and morale. Taking into account nutrition, workload, variety of diet, etc. and giving an overall indication of crew’s well-being will be useful in optimizing these systems, and for making the simulations more engaging.
Despite this imprecision, the measured system-level behaviors of the B2 missions are observable in the simulation. By making adjustments the base configurations, users can also observe the following phenomena:
- Plant growth can be increased by adding supplemental lighting (at the cost of increased electric consumption), or decreased by reducing CO2 setpoint to <700ppm.
- Crop layouts can be adjusted to add higher-yield crops, or crops which transpire and photosynthesize at different rates, affecting overall gas balances.
- The starting concrete carbonation rate can be adjusted, which affects the rate at which it consumes CO2. This is also affected by the ambient CO2 levels, with lower rates of carbonation when CO2 levels are lower.
- Adjusting the areas of each biome impacts (1) the size of the air sink, and therefore the overall changes in concentrations, (2) O2 and CO2 exchanges, as each biome has a different rate.