Research & Development

SIMOC B2 is live!

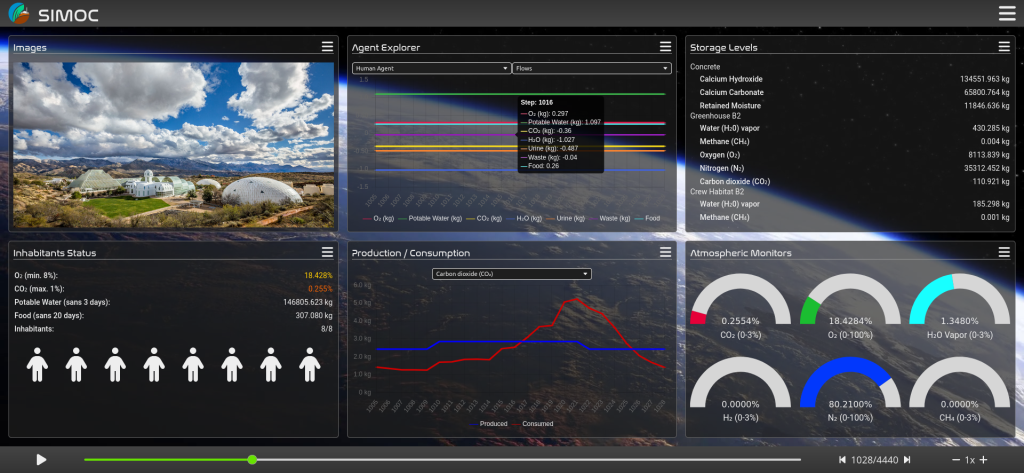
SIMOC B2 for Biosphere 2

In completion of a seven months development endeavor, a simulation of the original and second missions at Biosphere 2 are now incorporated into SIMOC and available for free from the National Geographic Society’s educational web portal.

The intent of SIMOC is to provide a model of Biological Life Support Systems for human space exploration. SIMOC was originally built around an ideal plant growth scenario (NASA CELSS growth chamber experiments and the NASA BVAD document), and was calibrated so that the simulation reproduced similar outcomes as given in published NASA experiments. The reality of a Moon or Mars habitat will be less than ideal, where the original Biosphere 2 missions are likely a closer approximation to how things might actually play out.

SIMOC B2 adds new degrees of freedom to the plant model (light response, planting density, crop management) as well as other new agents (concrete, biomes) such that the model reproduces experimental data from both NASA CELSS and the original Biosphere 2 missions with a single model. We attribute the large differences in plant productivity (up to 10x) and validate the system-level outputs against experimental B2 data.

By calibrating the model to these two extremes, we’re granting researchers, students and citizen scientists greater insight into the historical data from both and an opportunity to evaluate and compare a wider range of different BLSS scenarios with higher accuracy.

By |2023-04-12T07:29:06-07:00March 9th, 2023|Categories: Research & Development|0 Comments

The Biosphere 2 Configurations in SIMOC

by Grant Hawkins, lead developer for SIMOC B2 at Over the Sun, LLC

The final step of integrating Biosphere 2 into SIMOC was building the configuration files, which specify how many of each agent to include in a simulation, their starting resource balances, etc. Our aim was to replicate the real-life Biosphere 2 experiments: Mission 1 (September 26, 1991 to September 26, 1993) and Mission 2 (March 6, 1994 to September 7, 1994).

There was a major non-linearity in Mission 1 of course, which was the extra oxygen added to the habitat, beginning on January 12, 1993, 475 days into Mission 1. Some other changes were made throughout the experiment, such as adjusting the planting areas of different crops to maximize calorie-production and CO2-sequestration. To account for this, we split Mission 1 into two configurations: Mission 1a for before the O2 was added, and Mission 1b for after O2 was added. The configuration of 1b starts with the final atmosphere and concrete carbonation of Mission 1a, and includes an O2 resupply system and modified greenhouse layout.

The feature of significance for Mission 2 was improved plant productivity. We spoke with Tilak Mahato, one of the crew member on Mission 2 usually credited with improving output, and currently a researcher of Controlled Environment Agriculture at the University of Arizona. He described several specific practices that improved output:

  • Removing pests immediately. Because pest populations grow so quickly, catching and remediating an infestation early has an outsized impact.
  • Taking care not spread pests, fungi or diseases via contaminated tools.
    Washing diseased leaves with soap and water.
  • Protect seedling growing areas from roaches and other pests.
  • Pollinating plants by hand. During Mission 1, the entire corn crop had failed to produce food because there was no wind to spread pollen from the (male) tassels to the (female) silk. Other plants’ pollen had been washed away by overhead irrigation.

There was no ‘primary’ factor, according to Tilak, to which the improvements in productivity could be attributed. For this reason, we added a simple field to SIMOC, ‘Improved Crop Management’, which increases productivity of the plants by 50%, and describe the specific processes above in the SIMOC web app.

The result of these 3 configurations is encouraging so far!

By |2023-03-16T05:39:11-07:00February 14th, 2023|Categories: Research & Development|0 Comments

Concrete and Biosphere 2 Biomes

by Grant Hawkins, lead developer for SIMOC B2 at Over the Sun, LLC

Storytelling is a core part of SIMOC, especially when it comes to the educational components. As we integrate Biosphere 2 into SIMOC, we’re focused on telling one story in particular: how the soil and concrete conspired to crash O2 levels during Mission 1.

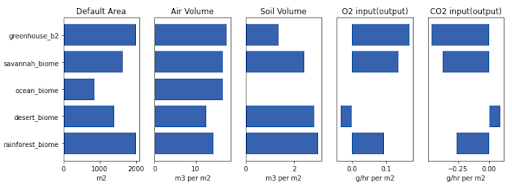
This story was first told in a research paper from January 1994, Oxygen Loss in Biosphere 2. Over the course of Mission 1, the O2 level in the habitat fell quickly, but the CO2 levels didn’t show the expected corresponding rise. The obvious hypothesis is that there was an unaccounted-for O2 consumer. The paper showed that in fact two separate processes were more active than was expected: soil respiration, which consumed O2 and produced CO2, and concrete carbonation, which consumed CO2. The combined effect of both of these was the observed ‘O2 consumer’. We created 5 new agents in SIMOC – 1 concrete and 4 soil-containing biomes – and calibrated them to the measurements in the research paper.

The concrete agent models the process of carbonation. Each step of the simulation, carbonation occurs based on a diffusion rate and a saturation point. The saturation point is heavily dependent on the current CO2 concentration in the atmosphere, however, more than 10x higher under extreme conditions like those at Biosphere 2, which accounted for the unexpected difference in total uptake. We corresponded by email with Bill Dempster, an author of the paper above, about the problem and our approach to it.

Concrete and Biosphere 2 Biomes by Grant Hawkins for SIMOC

The biomes model the combined effect of the soil and ground vegetation in the rainforest, savannah, desert and intensive agriculture biome (farm). A paper from 1999 measured the net productivity of the rainforest and desert biomes, and the Oxygen Loss in Biosphere 2 paper gives the habitat-wide soil respiration.

Concrete and Oxygen by Grant Hawkins for SIMOC

If all goes according to plan, the net effect of the humans, plants, concrete and biomes will be the drop in O2 observed in real life. This then becomes a story we can tell in SIMOC: the oxygen levels fall much faster than carbon dioxide rises, and the user can discover that it’s being ‘caused’ by the concrete and biomes.

By |2023-03-16T05:36:25-07:00January 29th, 2023|Categories: Research & Development|0 Comments

Plant Light Response

by Grant Hawkins, lead developer for SIMOC B2 at Over the Sun, LLC

In mid-2022, our team took on the challenge of modeling Biosphere 2 (B2) in SIMOC. Beyond simply describing the outcomes and making sure that they match the published data, we also had to make sure that — The system and sub-systems responded correctly to changes in the configuration. When a user changes the area of sweet potatoes or the CO2 scrubber activation threshold, other agents are responding appropriately to those changes.

The sub-systems remain accurate on the original SIMOC validation data, the NASA CELSS growth-chamber experiments. There, plants were grown in highly-controlled environments in order to maximize their food productivity. For certain plants, the production rate in kg/m2-day was as much as 10x greater at CELSS than in Biosphere 2.

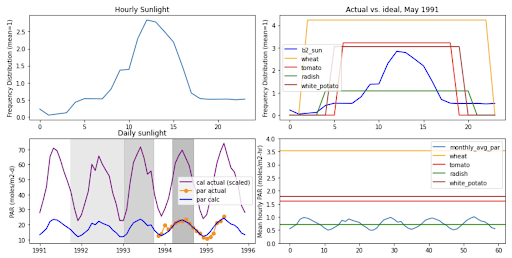
Light was found to be the biggest contributing factor to the differences in plant productivity. At CELSS, plants received constant-output electric lighting at an optimal level for an optimal number of hours per day. These ranged from 1.4 Mol/m2-h for 12 hours/day for rice, to 3.53 Mol/m2-h for 20 hours/day for wheat. At B2, the plants received whatever sunlight passed through the B2 windows and structural frame. Our approach was to use the CELSS data as the baseline for SIMOC plant consumption and production, and

The first step toward implementing SIMOC-B2 was to add a ‘light-response’ mechanism to the SIMOC plant agent. We added a new variable, ‘par_factor’, which scales the rate of biomass accumulation to the species-specific, hourly light requirement. The other functions of the plant (photosynthesis) are scaled to its total accumulated biomass, so the light response will be applied to those exchanges as well.

So this was a big step forward for the accuracy and flexibility of our plant growth model, but that wasn’t all. Some of the deeper changes to how exchange values are calculated led to a major reduction in memory footprint – more than 80% for simulations with more than one plant – which is great news for our cloud computing budget 🙂

Plant Light Response by Grant Hawkins for SIMOC

By |2023-03-16T05:36:58-07:00January 5th, 2023|Categories: Research & Development|0 Comments

Update from the SIMOC Development Team

The SIMOC development team has for the past six months been hard at work in developing two new versions of SIMOC: SIMOC B2 and SIMOC Live. SIMOC B2 is a new kind of simulation, a model of the first and second missions at Biosphere 2 in order to present citizen scientists with the tools to understand the challenges faced by the world’s largest and longest running human-in-the-loop bioregenerative experiment. SIMOC Live enables the real-time monitoring and capture of data from sensor arrays, such as those used to monitor carbon dioxide or oxygen levels, and other air quality measures.

We apologize for the lack of updates to this forum, but promise to catch-up (and back date) several stories soon!

By |2023-04-12T15:15:28-07:00December 19th, 2022|Categories: Research & Development|0 Comments

Update from Biosphere 2

This month brings new features and performance improvements. The migration to Vite is now complete, which has decreased startup time from around a minute to less than a second. A basic Kiosk mode is also now functional, and is being fine tuned.

Progress has been made on the Biosphere 2 simulation mode too, with new menus being developed such that a user can choose between whether they want to run a Mars simulation or a Biosphere 2 simulation, with corresponding visuals for each mode. New features are also being integrated into SIMOC’s model in order to account for factors that made the two Biosphere 2 experiments challenging, such as low light levels due to shadows cast by space frame and a year of heavy cloud cover in southern Arizona. The effect of pests and their role in the actual Biosphere 2 experiment are included, as well as a new agent to represent the concrete and associated carbon dioxide uptake.

By |2023-04-12T07:37:21-07:00October 6th, 2022|Categories: Research & Development|0 Comments

From Mars to Biosphere 2

Exciting new developments for SIMOC are underway. Research has started on implementing the agent based model to simulate Biosphere 2 itself, to replicate the original (1991-93) and second (1994) Biosphere 2 missions within SIMOC. A thorough literature review is being conducted by project lead Grant Hawkins with interviews being conducted with original Biosphere 2 crew members. Graphics are being designed in anticipation of the revised user interface.

Also, development is underway for a specially tailored SIMOC interface for use at exhibit kiosks. This streamlined version will have supplemental information, and automatically reset after periods of inactivity to make it more friendly for use at an exhibit where a person might interact with it briefly and then walk away without exiting the simulation.

By |2023-04-12T07:33:57-07:00September 4th, 2022|Categories: Research & Development|0 Comments

Automated Sensors

Some new developments have been made for SIMOC Live. For example, a new configuration file facilitates major improvements in sensor behavior. Now sensors are automatically recognized when they are attached, and if disconnected the data capture will resume automatically when the connection is restored. There are also new options for exporting sensor data via the educational web dashboard.

SIMOC developers have also taken additional steps to improve performance. Data transmission from back-end to front-end has again been made more efficient. The frameworks and libraries used in the codebase have also been updated. For instance, ChartJS, SocketIO, and Vue have all been changed to the latest versions, and the developers have begun to migrate from Vuex to Pinia which should yield a performance increase.

By |2023-04-12T07:44:16-07:00July 31st, 2022|Categories: Research & Development|0 Comments

Performance

The SIMOC development team has been hard at work improving the performance of SIMOC. Bugs that occurred when saving the game have been fixed in the latest code update, with a great many changes in the works to improve overall performance. In particular, performance due to many simultaneous instances of SIMOC are being addressed, for both cloud and local computing.

Core SIMOC developer Grant experimented with new ways to send batches of data and was able to achieve a 10x performance increase in performance. Lead SIMOC developer Ezio also found a way to cut load times in half. Ian has developed a test suite to stress test local and cloud servers, with an eye toward a return to locally managed servers for higher quality services. The development team also updated the Docker images on the backend to the latest version, and data logging has been improved.

Over the last few months, SIMOC developers have created features and interface improvements, with thorough tests in process. The SIMOC developer team is also working on the automation of startup scripts, and improving the appearance of charts as well as the variety of data that can be displayed on them.

By |2023-04-12T07:41:43-07:00June 19th, 2022|Categories: Research & Development|0 Comments

Major SIMOC update now live!

With more than six months development effort by the core SIMOC development team Ezio, Grant, and Kai, working in parallel to the Arizona State University Computer Science Capstone team (Meridith, Greg, Ryan, David, and Ian) who are nearly complete with their effort to introduce live sensors feeds into a new SIMOC back-end (server) and modified front-end (web) interface for use at SAM and in classrooms worldwide!

The Phase V development of SIMOC (July 2021 – May 2022) introduces staggered crop rotation of food cultivars, a foundation for tracking food nutrition, advanced life cycle plant growth functions, the addition of random variation and total system entropy, and improved server-side management of agent definitions and data to provide a more dynamic, rich experience with even greater potential for non-linear outcomes and simulation of the real world.

With construction of the SAM Mars habitat analog at the iconic Biosphere 2, SIMOC now includes SAM Presets, a configuration of the SIMOC simulation that closely approximates the real-world SAM habitat. And with the newly introduced 3D objects during Configuration and on the Dashboard, the user can now visualize the habitat before and during the simulation, including SAM.

  • Learn about all the improvements and updates at Phase V.
  • First Time Users: Enjoy a quick introduction before you dive.
  • Advanced Users: Learn how the SIMOC ABM functions, and how to analyze your data.
  • If you are a returning user eager to try the new version, launch SIMOC now!
By |2022-04-19T06:01:48-07:00April 19th, 2022|Categories: Research & Development|0 Comments
Go to Top