SIMOC Phase IIIb takes to the clouds!
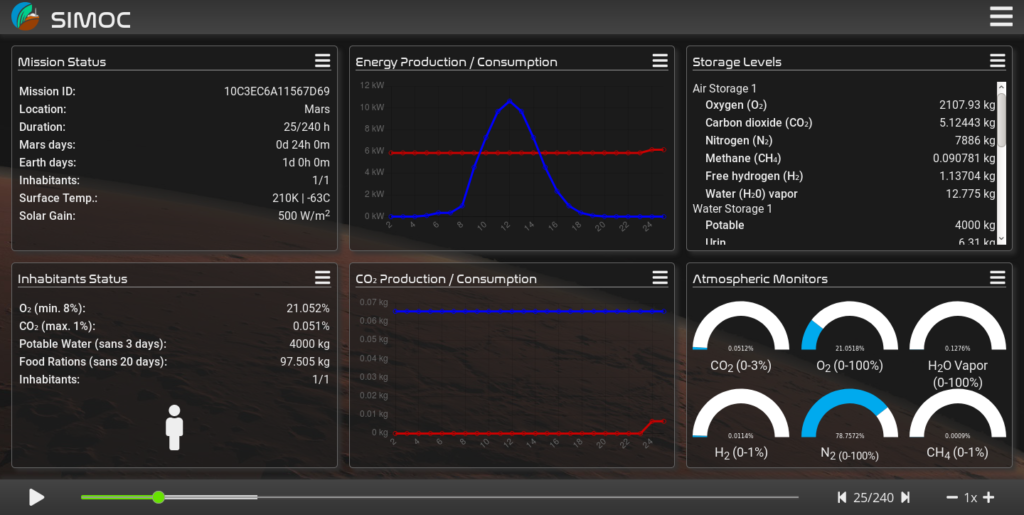
The SIMOC development team is nearly complete with server-side and front-end updates that now include support for cloud-based services such as those offered by Amazon, Google, and Microsoft. This major update saw a redesign of the database for fast read and write times, and greater scalability. What’s more, the Configuration Wizard now includes all updates as suggested by the National Geographic review panel. The configuration procedure is now simplified, the number of steps reduced, and a preferred configuration can be saved to the user’s local drive for re-loading with the next run. The Dashboard too is nearly complete, with simulation data download the final, remaining update. The panel layout and functionality is improved, with a number of features we are eager to share, soon.
Progress!